Welcome to our Knowledge Base
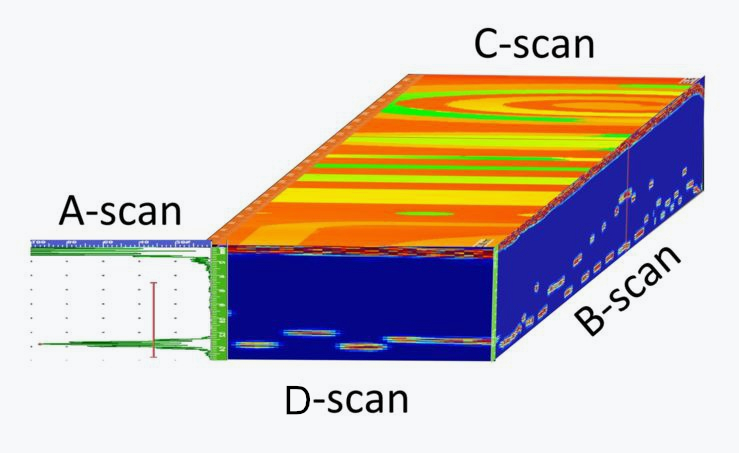
Data Representation
- A-scans: This view displays of signal amplitudes and time-of-flight data obtained at a single point on the surface of the testpiece
- B-scans: This view displays of signal amplitudes and time-of-flight data obtained along a line of the testpiece. The B-scan display shows the relative depth of reflectors and is used mainly to determine size (length in one direction), location (both position and depth), and to a certain degree the shape and orientation of large flaws
- C-scans: This view displays of signal amplitudes and time-of-flight data obtained obtained over an area of the testpiece surface. This information can be used to map out the position of flaws on a plan view of the testpiece.
- D-Scans. This view is identical to B-scan with the difference of being perpendicular to the line of motion of the B-Scan. A summation of several B and D-Scans creates a C-Scan.